SPMON
The SPMON Monitoring system (A Standard Platform for Monitoring) provides continuous
monitoring of health, performance and utilisation KPIs of managed Mission-Critical
Systems and Applications architectures.
SPMON.V3 Key Features
- The monitoring is done by collecting thousands of parameters from
Common-Off-The-Shelf (COTS) RFC SNMP Agents and from an own Agent, using the
SNMP protocol and its Security Framework.
- SPMON gives a deep inside in the monitored hosts available resources, running
processes, established connections and activities.
- The GUI displays in real-time the hosts resource consumption per Mission-Critical
Application (MCA) Task and related connections.
- It generated real-time Alerting and provides Trending, giving an inside
in possible future alerts.
- It provides continues recording of parameter values and event, for post
processing, graphing or troubleshooting purposes.
- It also allows to automate some tasks, based on the occurrence of user
defined events.

Customizable Graphical User Interface
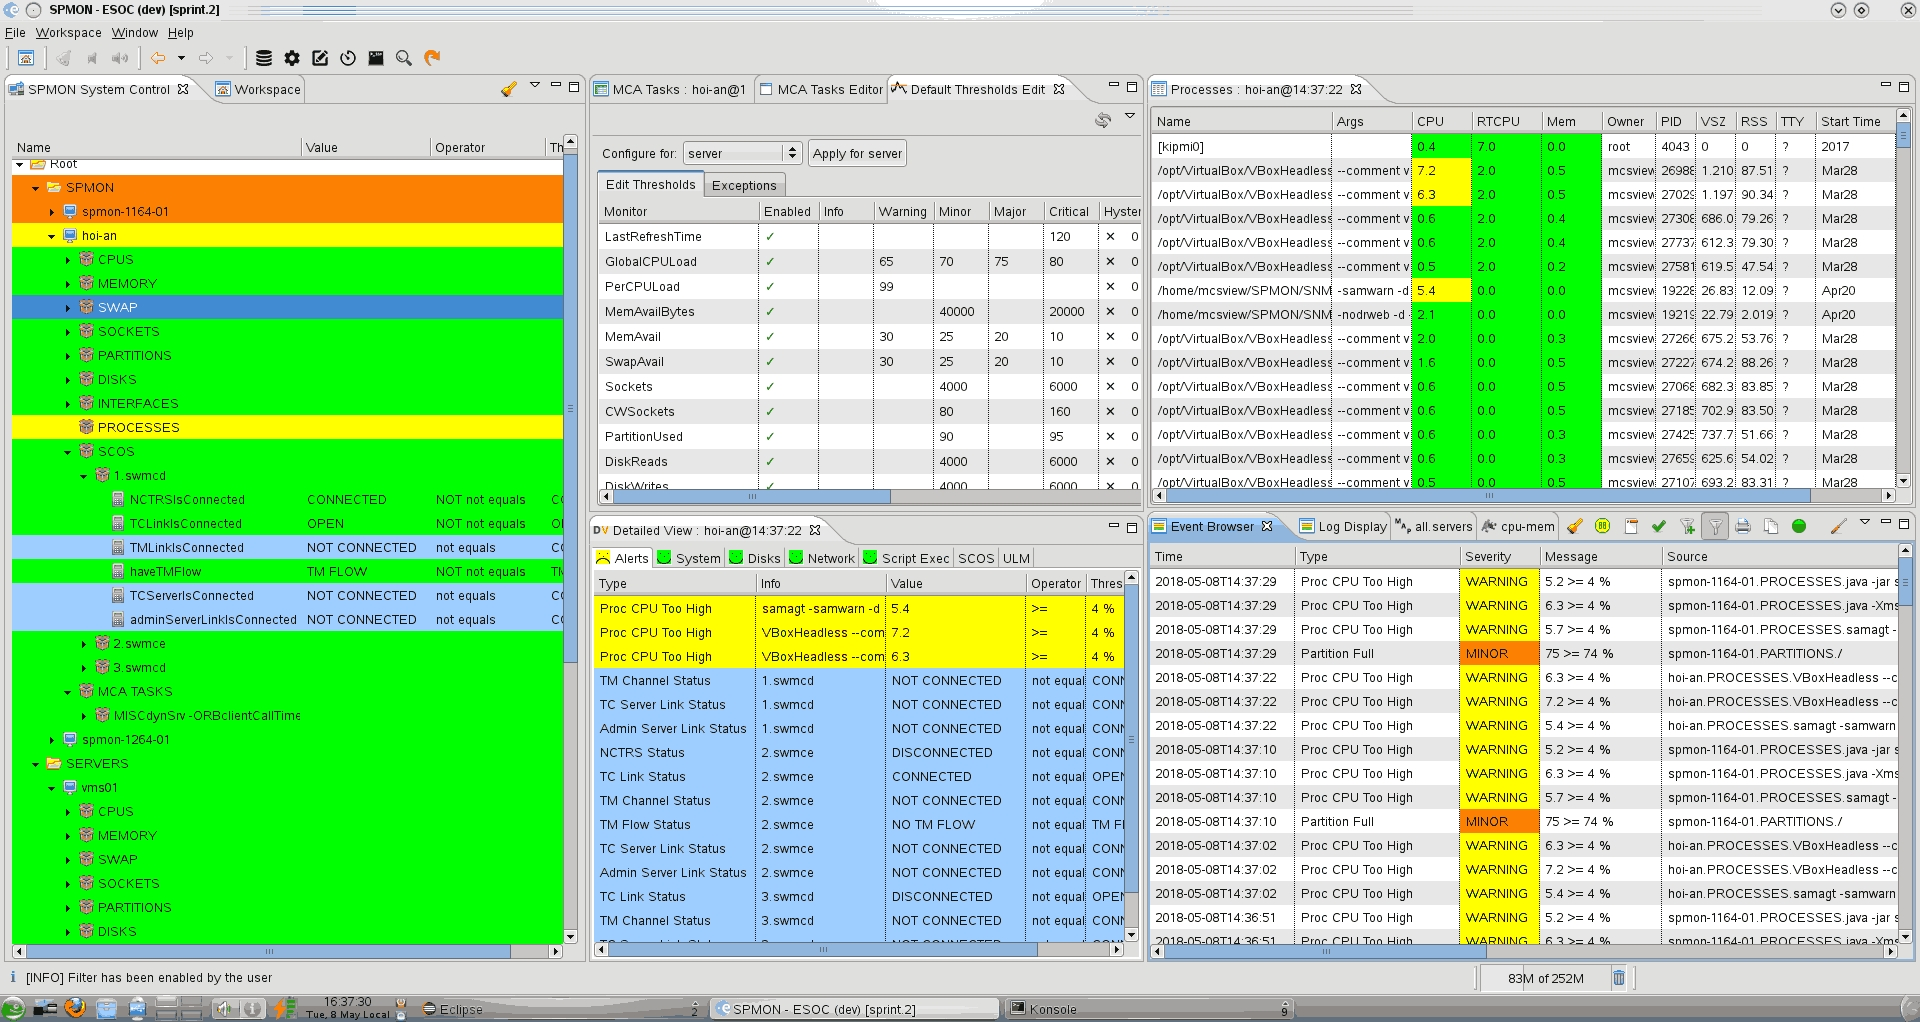
The Graphical User Interface is composed of many pre-defined and user customizable views.
- An "explorer-like" tree structure of hosts and system resources, allowing the user to drill-down into the resources, and showing the health status - using colour codes - in order to give an instantaneous view of pending alerts. It shows the standard computers resources, but also User-Defined Parameters, retrieved by custom scripts or programs, and their associated monitor statuses
- Tables of running processes and user pre-defined Mission Critical Tasks, associated with their resource consumption
- An Event Browser, showing a chronological list of occurred events and alerts
- A Message display, listing a trace of all SPMON tasks as they are performed, and all SPMON operators activity with the monitoring system
- Customizable Graphical Maps, showing a sub-set of monitored hosts displayed on a graphical background
- Custom tables of user selected resources that would require the operators special attention
- A so-called Detailed View, displaying resources and operational parameters of a selected monitored Mission Critical Application host: with standard tabs showing classical system resources and custom tabs presenting tabular data retrieved by user-provided scripts or programs
- A customizable Remote Command tool, allowing the SPMON operator to execute - with a single click - user-defined scripts or programs on a selection of multiple remote MCA hosts
- A Search Engine, that can find hosts that response to user defined search criteria, depending on live values of operational parameters.
Ease of Operations
The SPMON operator can - in real time - alter the behaviour of the SPMON monitoring system itself.
- Customise the frequency at which some or all hosts are polled for parameter value refresh, or even dynamically suspend any SNMP polling activity for a while
- Disable or enable E-mail Notification, Event Forwarding or Automatic Data Export to other NMS systems
- Disable or enable all executions of all Event-triggered automated action, of User-Defined Parameter retrieval and/or of User-Defined Tabular Data retrieval
- Disable or enable recording of Parameter values and/or Event and/or Trending data and/or volatile History
- Disable or enable Automatic Configuration DB synchronisation between SPMON (prime and backup) systems
- Disable or enable Trending for a selection of Alerts
- Tune the logging of activity and processing traces
Openness and Flexibility
In addition to the many standard operating system parameters that the SPMON system monitors from the MCA hosts, custom defined parameters (Key Performance Indicators - KPI’s) and tabular data about context-specific Mission Critical Applications can easily be added to the monitoring tool, and fully integrated into the multiple SPMON GUI.
The operator has to define what parameters and/or detailed view tabs and tables are to be added, and how (what script or program) their values can be obtained. Their new values will be collected together the built-in ones, and individual parameters alerts will be generated when one of their thresholds will be exceeded.
Integration with other NMS systems
The integration with "higher" level umbrella Monitoring systems, has been achieved by implementing:
- The Event forwarding capability, supporting SNMP v2c and v3 traps and informs
- The development of an own SPMON SNMP Agent, exporting high-level data to the "higher" Monitoring systems
- And the offline notification of operators through SMTP E-mail dispatching
